On the basis of some 250 Ukrainian UFO reports in the 2002 members of the club was able to construct a circuit UFODOS UFO activity as a function of spatial coordinates. It turned, that 15% Message (in 2011 year - 20%) came from the east year - (3 of), same with the central regions (5 areas) (in 2011 year - 13%), from the west — 19% (8 areas) (in 2011 year — 11%), from north — 25% (4 of) (in 2011 year - also 25%) and south — 26% (5 areas) (in 2011 year — 31%).
|
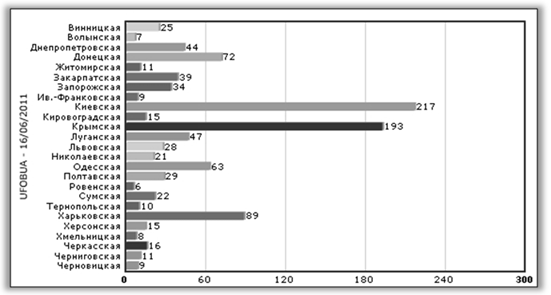
The distribution of Ukrainian UFO on areas of the country. Data UFOBUA: 1042 cases as of June 2011 year |
Was constructed and a more detailed map of UFO activity over Ukraine, which shows, that the most favored region in the country Kiev, The Crimean, Odessa and Kharkov. The same results were obtained in 2011 year. Quantitative distribution of cases by area see on the chart. Stable activity in these areas is projected to continue our, Considering the dynamics of, as well as some limitations of the areas.
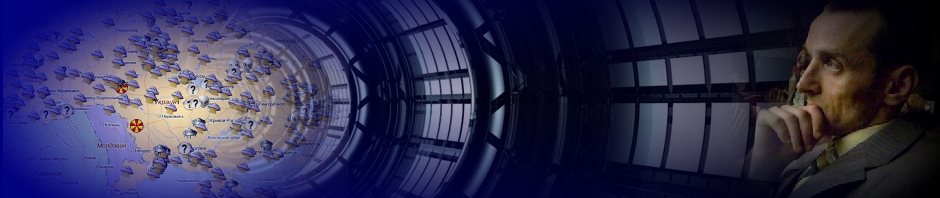
If you put all of our cases with a UFO over the Ukraine on the map, we see the characteristic distribution of marks in the area of so-called "Ukrainian-Russian Triangle". This is a conditional district, limited by three points (Kiev-Voronezh Crimea), most active in terms of the appearance of UFOs Urban. See and Krym (especially the South Coast) always were in the lead from the observations of UFOs. Regarding the third, Russian point of this, almost perfect triangle on the map, Voronezh is, is an independent geo-active zone (many references it is referred to as "anomalous zone Voronezh"). In this triangle are the major Ukrainian cities: Dnepropetrovsk, Zaporozhye, Poltava, Kharkiv, Simferopol, Kherson, Kirovograd ... in the sky which are frequent UFO sightings (relative to other cities not included in the "triangle"), as well as independent anomalous zones, такие как «Запорожские Круги», "Kharkiv anomalous zone", etc.
The time factor, or when we expect a UFO? Methods of mathematical statistics were able to identify a number of UFO sightings patterns depending on the time. Charts were drawn up on UFO sightings, depending on the temporal parameters: year, months of the year, depending on time of day, etc..
Years. Starting with one-year intervals, we have seen from the sum of the existence of strange messages Ukrainian, similar to the solar (once a 11 years) UFO activity, which is expressed flyapami at the end of the decade. Most clearly follow this trend can only be the last 30 years: UFO activity in the 1989, in 1999, 2009 years. This trend is so stable, that we can safely predict the activity of a UFO 2019 year, etc..
A more detailed statistical treatment of the vast number of reported UFO sightings in UFO organizations and independent groups (in different countries) showed, that the second half and particularly the last few years of each decade — years, figuratively speaking, "UFO invasion" (используются такие термины как «активизация НЛО», "UFO boom", "A plate boom", "UFO fever", "Flyap"). It must be stressed, that for the entire second half of the twentieth century, this trend has never been broken. A first periodic time-limited bursts of large numbers of UFO reports, in individual countries, and around the world, were recorded in the XIX century.
Speaking about the factors, behind "flyapami" UFO, researchers do not skimp on the version. Some people think, that in certain periods of time the Earth is in those regions of space, where there is no "valid" ordinary three-dimensional measurement, and we are seeing "UFO invasion" — is currently the intersection of two worlds in one plane!